
Interested in the current ebb and flow of the tides? Using a Raspberry Pi Zero 2 and an E-Paper display, you can create an informative a low powered tide display. The code for this project can be found on my github.
In this guide, I will walk you through the steps to build a tide information display that provides frequent updates on tide height and corresponding times of high and low tide. Dive in and embark on this exciting project to stay connected with the rhythm of the ocean.
Overview of the Raspberry Pi E-Paper Display#
The project requires only the following parts:
Required Parts and Equipment#
- Raspberry Pi Zero 2
- E-Paper Display
- Raspberry Pi 0 E-Paper Case
- Micro SD Card
- A Micro USB wire for power
Setting Up the Hardware#
- Solder the header pins to the Raspberry Pi Zero (Skip if you purchased a board with pre soldered header pins)
- Create the SD card with image of Raspberry Pi OS
- Insert micro SD card
- Construct the case
- Connect the E-Paper Display to your Raspberry Pi pins.
- Finish case construction
- Connect power to Raspberry Pi
- Test that you can connect via terminal that the Raspberry Pi is Running.
- Check for updates and install
- Install the required libraries
- Run test code to confirm screen is working
The Library Installs#
sudo apt-get update sudo apt-get install python3-pip sudo apt-get install python3-pil sudo apt-get install python3-numpy sudo pip3 install RPi.GPIO sudo pip3 install spidev sudo pip3 install pytzScreen Test#
Depending on the Screen you have purchased select the relevant test code file. I have a 2.13 inch Red, Black, and White screen so have used epd_2in13bc_test.py to confirm that the e-paper screen is working as expected.
git clone https://github.com/waveshare/e-Paper.gitcd e-Paper/RaspberryPi_JetsonNano/python/examplespython3 epd_2in13bc_test.pyDeploy the code#
Clone the code from my github repo
git clone https://github.com/Dr-Passmore/e-paper-tidal-info-projectcd e-paper-tidal-info-projectpython3 main.py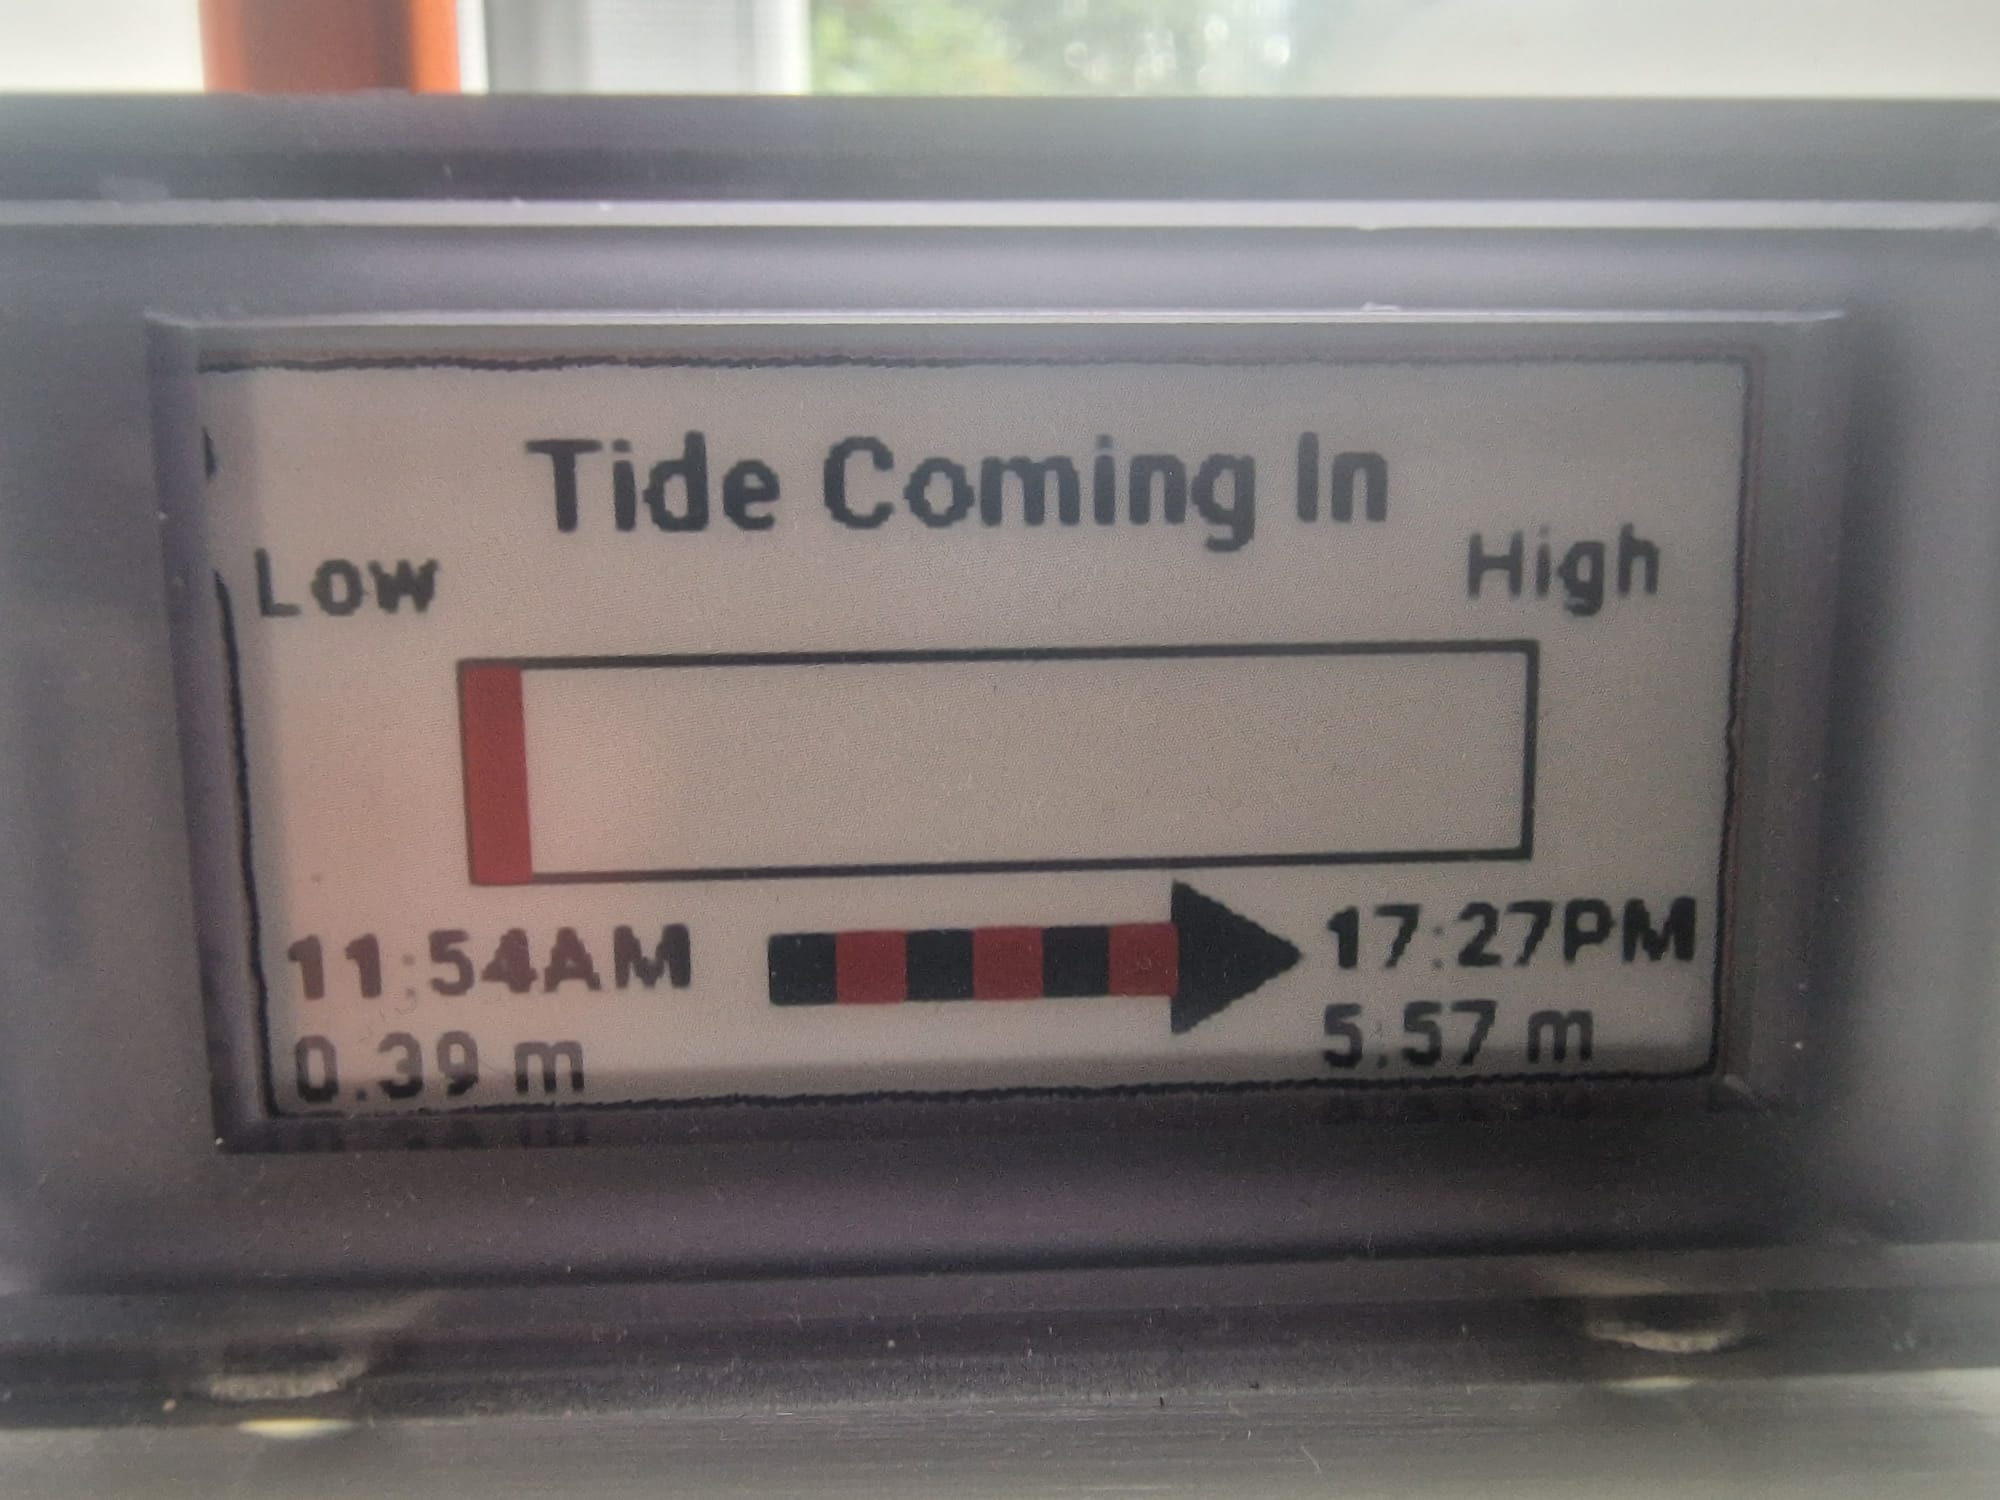
On first time running it will request an API key which is stored in the config file config.ini. The following section covers setting up the API key:
Collecting Tide Data#
For UK data I am using the admiral API, in particular, I am using the UK Tidal API - Discovery, which has a maxium API calls of 10,000 per month.
Get API Key#
If using the Admiralty API:
- Create an account with Admiralty
- Subscribe to the UK Tidal API - Discovery API
- Get the newly created API Key
Processing Tide Data#
The python file 'tideInfo.py' contains the function to call the API and get a JSON file containing the data.
@staticmethoddef get_data():    """    Retrieves tidal event data from the Admiralty API.
    Output:    - data: JSON data containing tidal event information.    """    logging.info('Requesting json file from Admiralty API')            # Read the API key from config.ini    config = configparser.ConfigParser()    config.read('config.ini')    apiKey = config.get('API Key', 'Key')            try:        with urllib.request.urlopen(f"https://admiraltyapi.azure-api.net/uktidalapi/api/V1/Stations/0005/TidalEvents?duration=2&key={apiKey}") as url:            data = json.load(url)            logging.info('Request completed')            return data    except Exception as e:        logging.error('Failed to get data from Admiralty API')        logging.error(f'{e}')        einkDisplayUpdate.einkUpdate.error_display(e)
If the API call fails, the script logs the error and updates the display with the error message.
To get the location you are interested in you will need to update the Stations code: https://admiraltyapi.azure-api.net/uktidalapi/api/V1/Stations/0005/TidalEvents?duration=2&key={apiKey} For example, Falmouth is 0005.
Tide Station Examples#
| ID | Name | Country | Continuous Heights | Footnote |
|---|---|---|---|---|
| 0001 | ST. MARY'S | England | True | |
| 0002 | PENZANCE (NEWLYN) | England | True | |
| 0002A | Porthleven | England | True | |
| 0003 | Lizard Point | England | True | |
| 0004 | Coverack | England | True | |
| 0004A | Helford River (Entrance) | England | True | |
| 0005 | FALMOUTH | England | True | |
| 0005A | Truro | England | False | Dries out except for river water |
| 0007A | Par | England | True | |
| 0008A | Lostwithiel | England | False | Dries out except for river water |
Full station information has been pulled from API and converted into a csv for easy browsing
Now we have the data returned to 'main.py' it needs to be processed. We are interested in displaying the last tide event and the next tide event, so the rest of the data can be discarded.
To do this the script loops through the data. The next event is in the future so the loop breaks when it reaches the next event, and past events overwrite until the next event is covered.
for x in data:    event = (x['EventType'])    height = (x['Height'])    eventTime = (x['DateTime'])    eventTime = eventTime[:19]                        when = datetime.datetime.strptime(eventTime,"%Y-%m-%dT%H:%M:%S")    recordsdate = when    timestamp = datetime.datetime.timestamp(when)    now = time.time()    eventTime = eventTime[11:16]    if timestamp > now:        break    else:         pastevent = event        pastheight = height        previousEventTime = eventTime        prioreventTime = timestamp
progress = TideInformationDisplay.percentage_calculation(self, timestamp, prioreventTime, now, event)The percentage of the progress bar is calulated in the percentage_calculation function
def percentage_calculation(self, timestamp, prioreventTime, now, event):    """    Calculates the progress percentage between previous and next tide events.
    Input:    - timestamp: Timestamp of the next tide event.    - prioreventTime: Timestamp of the previous tide event.    - now: Current timestamp.    - event: Type of tide event (e.g., "HighWater" or "LowWater").
Output: - progress: Progress percentage between previous and next tide events. """ timeRemaining = (timestamp - now) / 60 timeSince = (now - prioreventTime) / 60 total = timeRemaining + timeSince percentage = 100 / total progress = percentage * timeSince if event == "LowWater": progress = 100 - progress return progressThis provides the percentage until the next tide event.
In addition, in the config the highest and lowest tides heights are recorded.
if event == 'HighWater': currentRecord = config.get('Records', 'Highest Tide Height') if float(currentRecord) < height: logging.info(f"New {event} record set of a height of {height}M") config.set('Records', 'Highest Tide Height', str(height)) config.set('Records', 'Highest Tide Date', str(recordsdate)) with open(r"config.ini", 'w') as configuration: config.write(configuration) else: currentRecord = config.get('Records', 'Lowest Tide Height') if float(currentRecord) > height: logging.info(f"New {event} record set of a height of {height}M") config.set('Records', 'Lowest Tide Height', str(height)) config.set('Records', 'Lowest Tide Date', str(recordsdate)) with open(r"config.ini", 'w') as configuration: config.write(configuration)
This information is used in the loading screens between refreshes.
Displaying Tide Information#
I always find the main challenge of any e-paper display project is getting the display layout right. This also takes longer to test as you need to wait for the display to update. Considering this is my third e-paper display project I still found the layout to be the most painful process.
The goals I had for this project was:
- Design a user-friendly interface to clearly display the tide information.
- Effectively, display the progress using a bar.
- If there is an error, then I wanted the display to clearly show there was an error.
- Display high and low tide records, from data the Pi Zero has processed as a loading screen.
Loading screen#
The loading screen displays either the lowest or highest tide level.
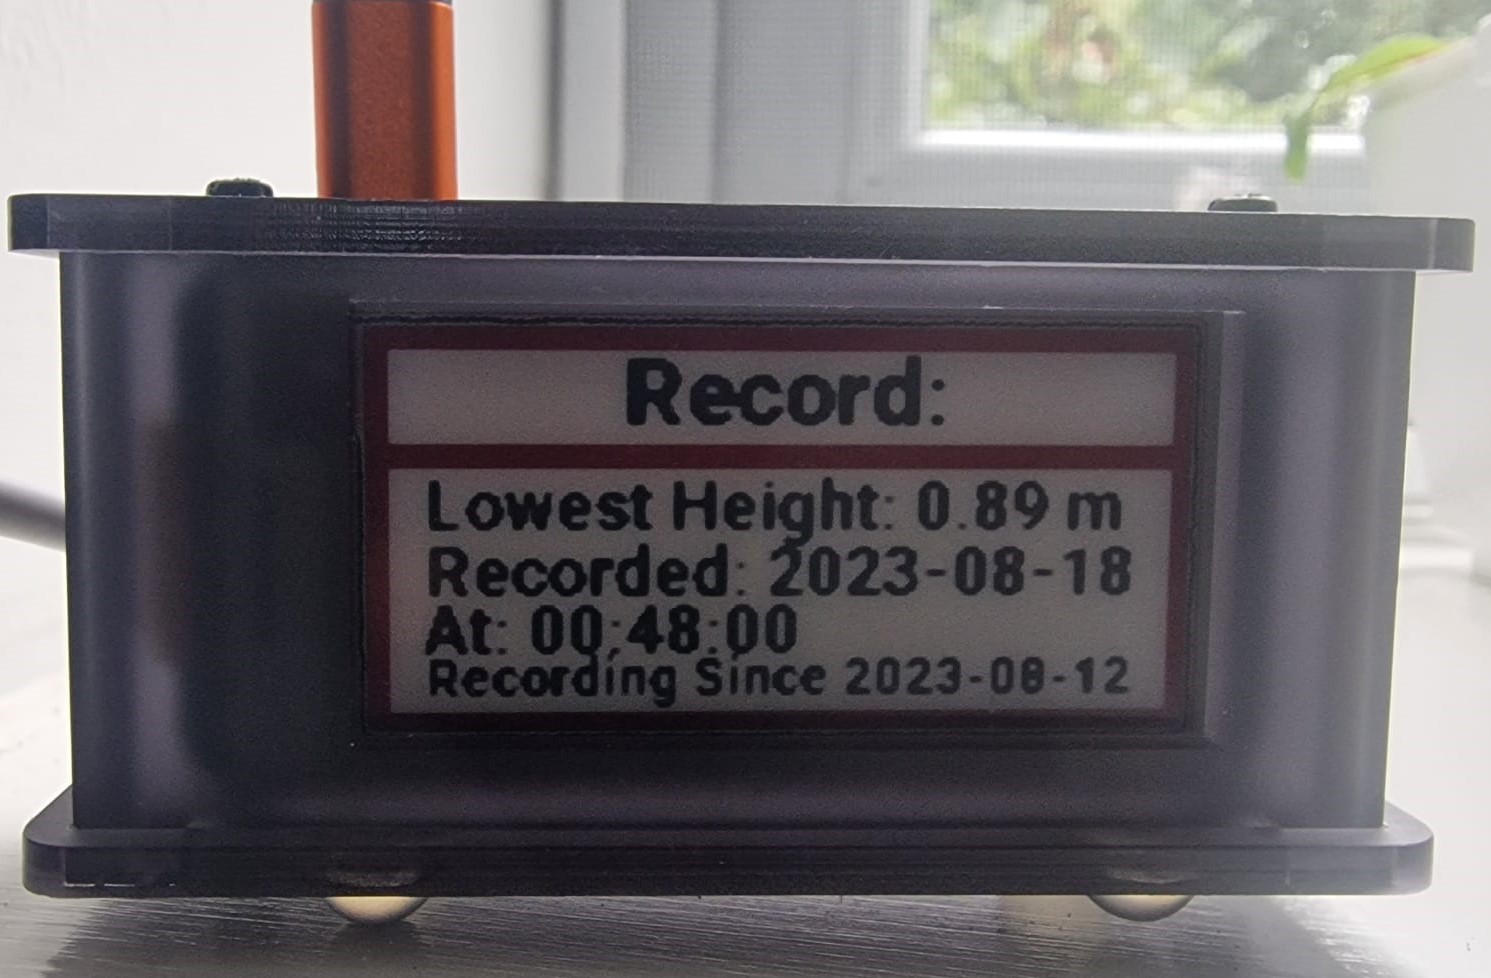
There is a random selection which then grabs the relevant data from the config.ini to display.
# Selection process for whether the loading screen shows low or high tide recordpreviousRecords = ["high", "low"]selection = random.choice(previousRecords)
# If high tide recorded select it provides the height, date and time recorded. Along with start date the screen has been running fromif selection == "high":    highest_tide_datetime = datetime.strptime(highestTideDate, "%Y-%m-%d %H:%M:%S")    daterecorded = highest_tide_datetime.strftime("%Y-%m-%d")    timerecorded = highest_tide_datetime.strftime("%H:%M:%S")    drawLoadBlack.text((15, 35), f'Highest Height: {float(highHeight):.2f} m', font=robotoblack18, fill=0)    drawLoadBlack.text((15, 52), f'Recorded: {daterecorded}', font=robotoblack18, fill=0)    drawLoadBlack.text((15, 67), f'At: {timerecorded[0:5]}', font=robotoblack18, fill=0)    drawLoadBlack.text((15, 82), f'Recording Since {startDate}', font=robotoblack14, fill=0)        # If low tide recorded select it provides the height, date and time recorded. Along with start date the screen has been running fromelse:     lowest_tide_datetime = datetime.strptime(lowestTideDate, "%Y-%m-%d %H:%M:%S")    daterecorded = lowest_tide_datetime.strftime("%Y-%m-%d")    timerecorded = lowest_tide_datetime.strftime("%H:%M:%S")    drawLoadBlack.text((15, 35), f'Lowest Height: {float(lowHeight):.2f} m', font=robotoblack18, fill=0)    drawLoadBlack.text((15, 52), f'Recorded: {daterecorded}', font=robotoblack18, fill=0)    drawLoadBlack.text((15, 67), f'At: {timerecorded}', font=robotoblack18, fill=0)    drawLoadBlack.text((15, 82), f'Recording Since {startDate}', font=robotoblack14, fill=0)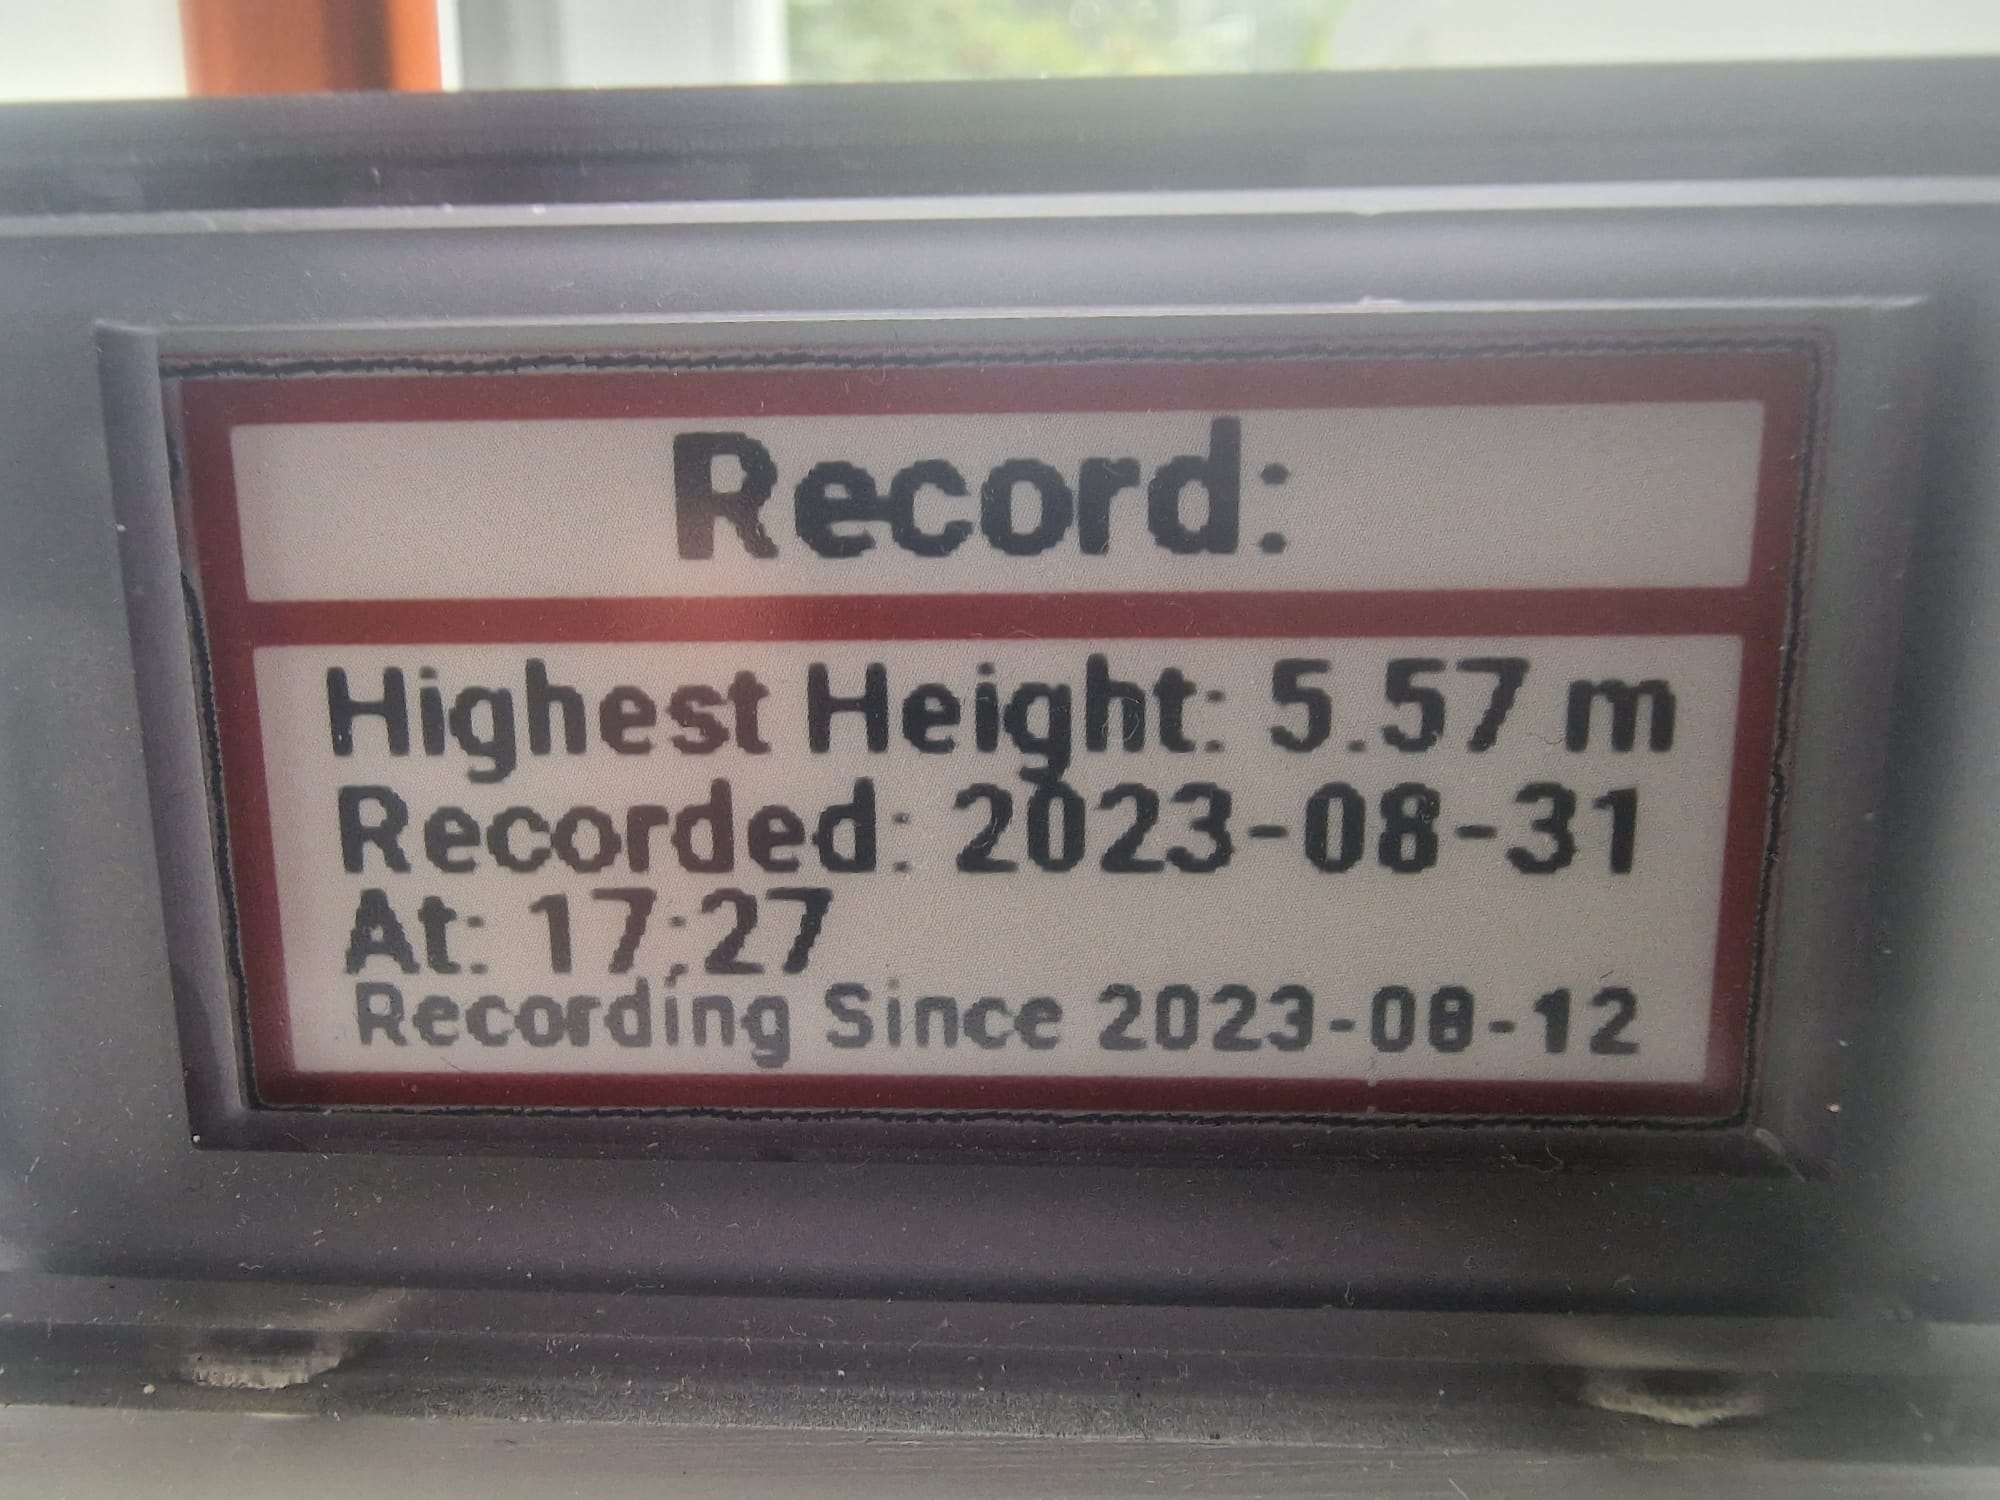
The loading screen only shows for a minute. I found it interesting to keep track of the highest and lowest tide, so added the loading screen. Due to the limitations of screen size, I used the random selection to prevent the screen being to busy.
Main Screen#
The main screen primarily displays a progress bar, an arrow to give a quick visual indicator of whether the tide is going out or coming in.
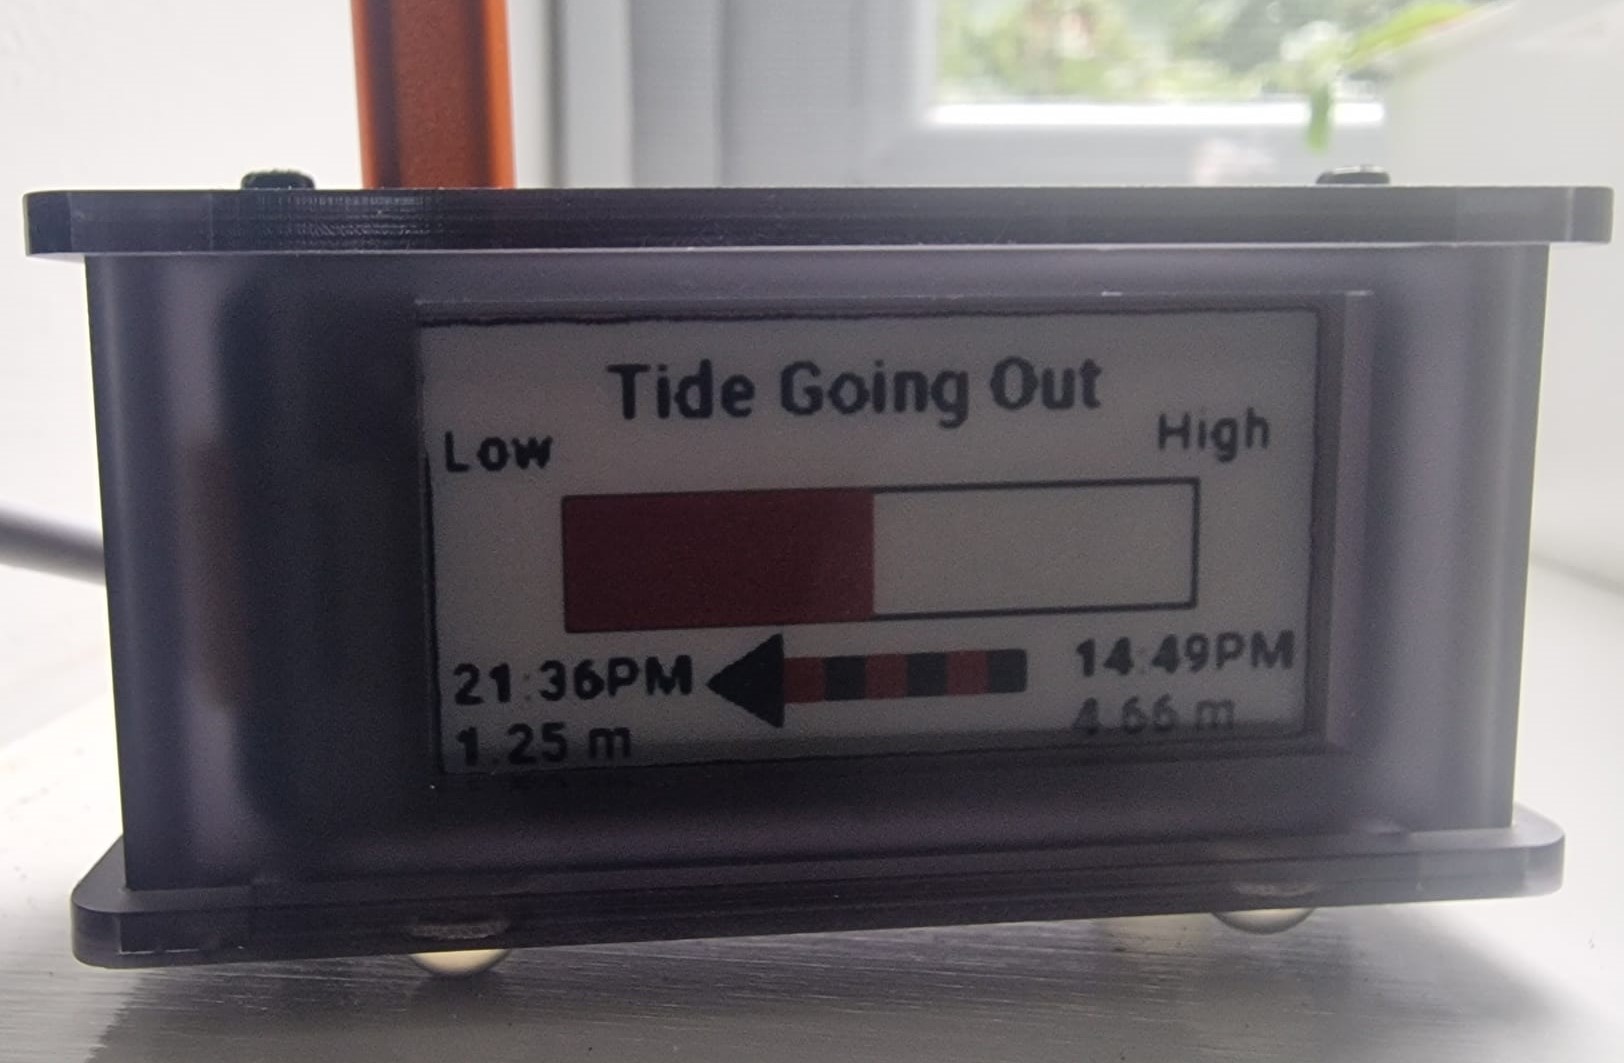
The progress bar converts the percentage value to a rectangle with one of the location values using the progressDraw value (plus 30 away from the edge of the screen).
# Progress Bar draw_other.rectangle((30, 70, 30 + progressDraw , 40), fill=0) drawblack.rectangle((29, 39, 30, 71), fill=0) drawblack.rectangle((182, 39, 183, 71), fill=0) drawblack.rectangle((29, 70, 183, 71), fill=0) drawblack.rectangle((29, 39, 183, 40), fill=0)The progressDraw is an int number between 7 and 152 selected from dictionary that has split 100% by 30.
def progressBar(progress): progressBarLength = float(progress) #212 - 30 - 30 = 152 progress_map = { (0, 3.33): 7, (3.33, 6.66): 12, (6.66, 9.99): 17, (9.99, 13.32): 22, (13.32, 16.65): 27, (16.65, 19.98): 32, (19.98, 23.31): 37, (23.31, 26.64): 42, (26.64, 29.97): 47, (29.97, 33.30): 52, (33.30, 36.63): 57, (36.63, 39.96): 62, (39.96, 43.29): 67, (43.29, 46.62): 72, (46.62, 49.95): 77, (49.95, 53.28): 82, (53.28, 56.61): 87, (56.61, 59.94): 92, (59.94, 63.27): 97, (63.27, 66.60): 102, (66.60, 69.93): 107, (69.93, 73.26): 112, (73.26, 76.59): 117, (76.59, 79.92): 122, (79.92, 83.25): 127, (83.25, 86.58): 132, (86.58, 89.91): 137, (89.91, 93.24): 142, (93.24, 96.57): 147, (96.57, 100): 152 } for range_start, range_end in progress_map: if range_start <= progressBarLength < range_end: return progress_map[(range_start, range_end)] return 0 Once this function has returned the int, an additional 30 is added as this takes into account the border of the screen.
Error Screen#
The error screen simply displays the error and draws attention that the screen is no longer correctly updating.
# Error Messagedrawblack.text((15, 45), f'{e[0:16]}', font = robotoblack18, fill = 0)drawblack.text((15, 65), f'{e[16:]}', font = robotoblack18, fill = 0)draw_other.text((55, 2), "ERROR!", font=robotoblack28, fill=0) # Draws Red Borders around the screen and between the title and error messagedraw_other.rectangle((0, 0, epd.height, 5), fill=0)draw_other.rectangle((0, 30, epd.height, 35), fill=0)draw_other.rectangle((0, 30, 5, 0), fill=0)draw_other.rectangle((207, 30, 212, 0), fill=0)draw_other.rectangle((0, 99, 212, 104), fill=0)draw_other.rectangle((0, 31, 5, 104), fill=0)draw_other.rectangle((207, 0, 212, 104), fill=0)This simply draws out a clear error message.
Updating the display#
The display needs to update regularly and to update the display I'm using a scheduled cron job. This runs the screen_refresh.sh script which calls the main.py file.
Firstly, you need to make the screen_refresh.sh executable.
chmod +x screen_refresh.shSecondly, you need to create the cron job.
crontab -eI recommend selecting nano as editor.
Add the following:
*/15 * * * * /home/pi/e-paper-tidal-info-project/screen_refresh.shNow the script will run every 15 minutes.
Conclusion#
Finally, we have a e-paper display updating every 15 minutes to inform you of the current tide height, the times of low tide, and high tide. As normal the development time really came from the e-paper display. Mainly due to the time it takes to update the code, commit the code, git pull on the Raspberry Pi, and then wait for the display to load. Perhaps in the future, I may look at this project again. I already have an idea for a larger version, taking images at Swanpool at different tide heights and converting them to black and white images for a e-paper disply in a picture frame.
Even with the effort e-paper displays take to get set up, I do find them deeply rewarding projects to complete.
Update#
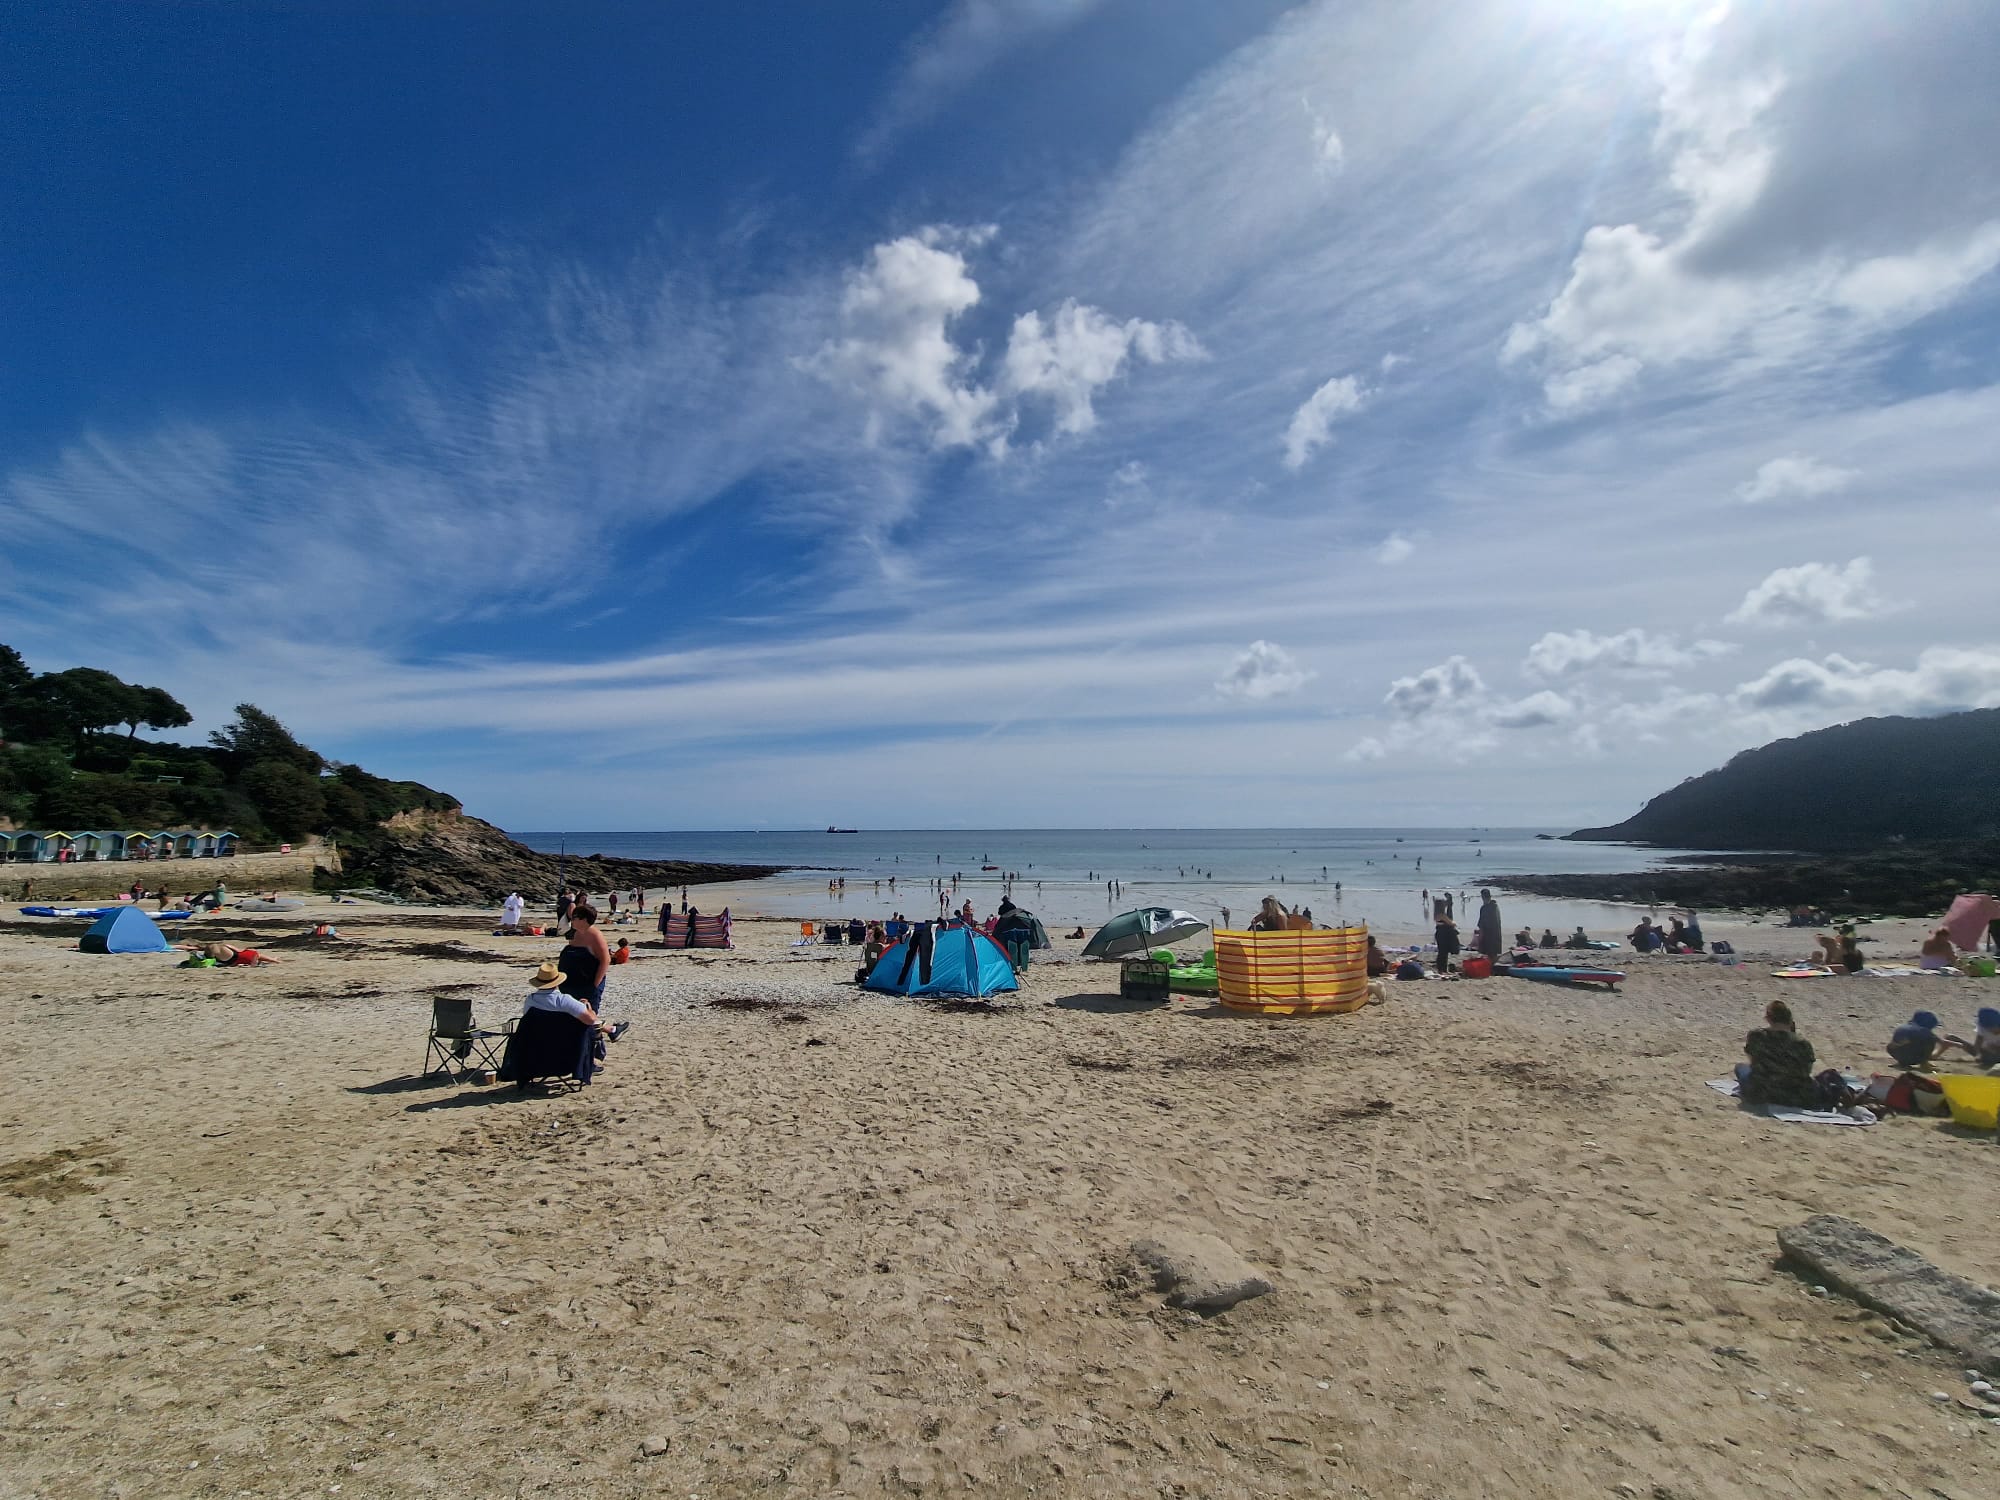
I noticed that the tide information was slightly off. I was walking by Swanpool beach after I had seen low tide was an hour before... Only for the tide to clearly be at the lowest point.
Turns out I overlooked British Summer Time when I compared a Falmouth tide information data source.
To resolve this issue, I have used the pytz module to update the time captured from the API so it is in the correct time zone. An additional, function has been added to main.py:
def updateTimeZone(self, eventTime):        """        Converts a datetime string to the 'Europe/London' time zone.
        Input:        - eventTime: A datetime string in the format '%Y-%m-%dT%H:%M:%S'.
Output: - A string representation of the datetime in 'Europe/London' time zone. """ local_tz = pytz.timezone("Europe/London") eventTime = datetime.datetime.strptime(eventTime, '%Y-%m-%dT%H:%M:%S') return str(eventTime.replace(tzinfo=pytz.utc).astimezone(local_tz))Now this function has been added the problem has been resolved. Amusingly, I was rather confident in my data, I did not think to compare to another data source. Lesson learnt!